



This article centres on weight loss in women before menopause, though much of it applies equally to women past menopause and to men.
Anna: Micaela, you spent six months disagreeing with your bathroom scale, and by the end you achieved your goal. Let’s decode what happened based on the science. I wrote a piece this spring on the hidden pattern behind weight gain. Yours came through six months of tracking your body, every morning. When your data and my work found each other, it only made sense to write this article together.
So we did. It reads as a conversation between us. Anna writes in purple, Micaela in teal.
Let’s hear it the way you lived it, from the first morning.
Micaela: Mindless eating had crept in over the months before Christmas 2020, the kind that happens without drama and without a clear moment you can point to. Too much sugar? Too much of everything, probably. Life had been busy, not to mention the fact that the world was in lockdown. The accumulation was gradual enough that I almost didn’t notice it, which is exactly what made it uncomfortable when I finally did.
I am, by training, a researcher. I spent years in a lab asking questions, designing experiments, and resisting the urge to draw conclusions before the data was in. So when I decided to do something about what I was seeing, I did not reach for a diet plan. I decided to apply a few basic rules in my nutrition and movement, collect my own data and see what it told me.
I find the idea of n=1 studies (where there’s only one subject) somewhat funny and genuinely powerful in equal measure. Published research shows you averages and mechanisms. Averages are useful, but they describe a population, not you. Your own data shows you how those averages actually apply to your body, your cycle, your week, your Saturday movie night. That specificity is also how I ended up discovering something I was not looking for.
Concerning the scale, it cost roughly 29 euros and lives on my bathroom floor. It is a consumer bioimpedance device, which means it estimates body composition by passing a small electrical current through your body and measuring resistance. It is NOT a laboratory instrument.
I never trusted the absolute numbers it gave me. What I trusted was the direction: trending down, by roughly how much, over what timeframe. The relative story, not the precise figure.
The Experiment
What I did
For about 90 days, from January to March 2021, I tracked. Every morning: a body-composition reading from the scale. Every meal, logged by hand in a paper diary. Sleep quality, daily steps, activity, bloating, energy levels, mood, and where I was in my cycle. Not a diet. A data collection.
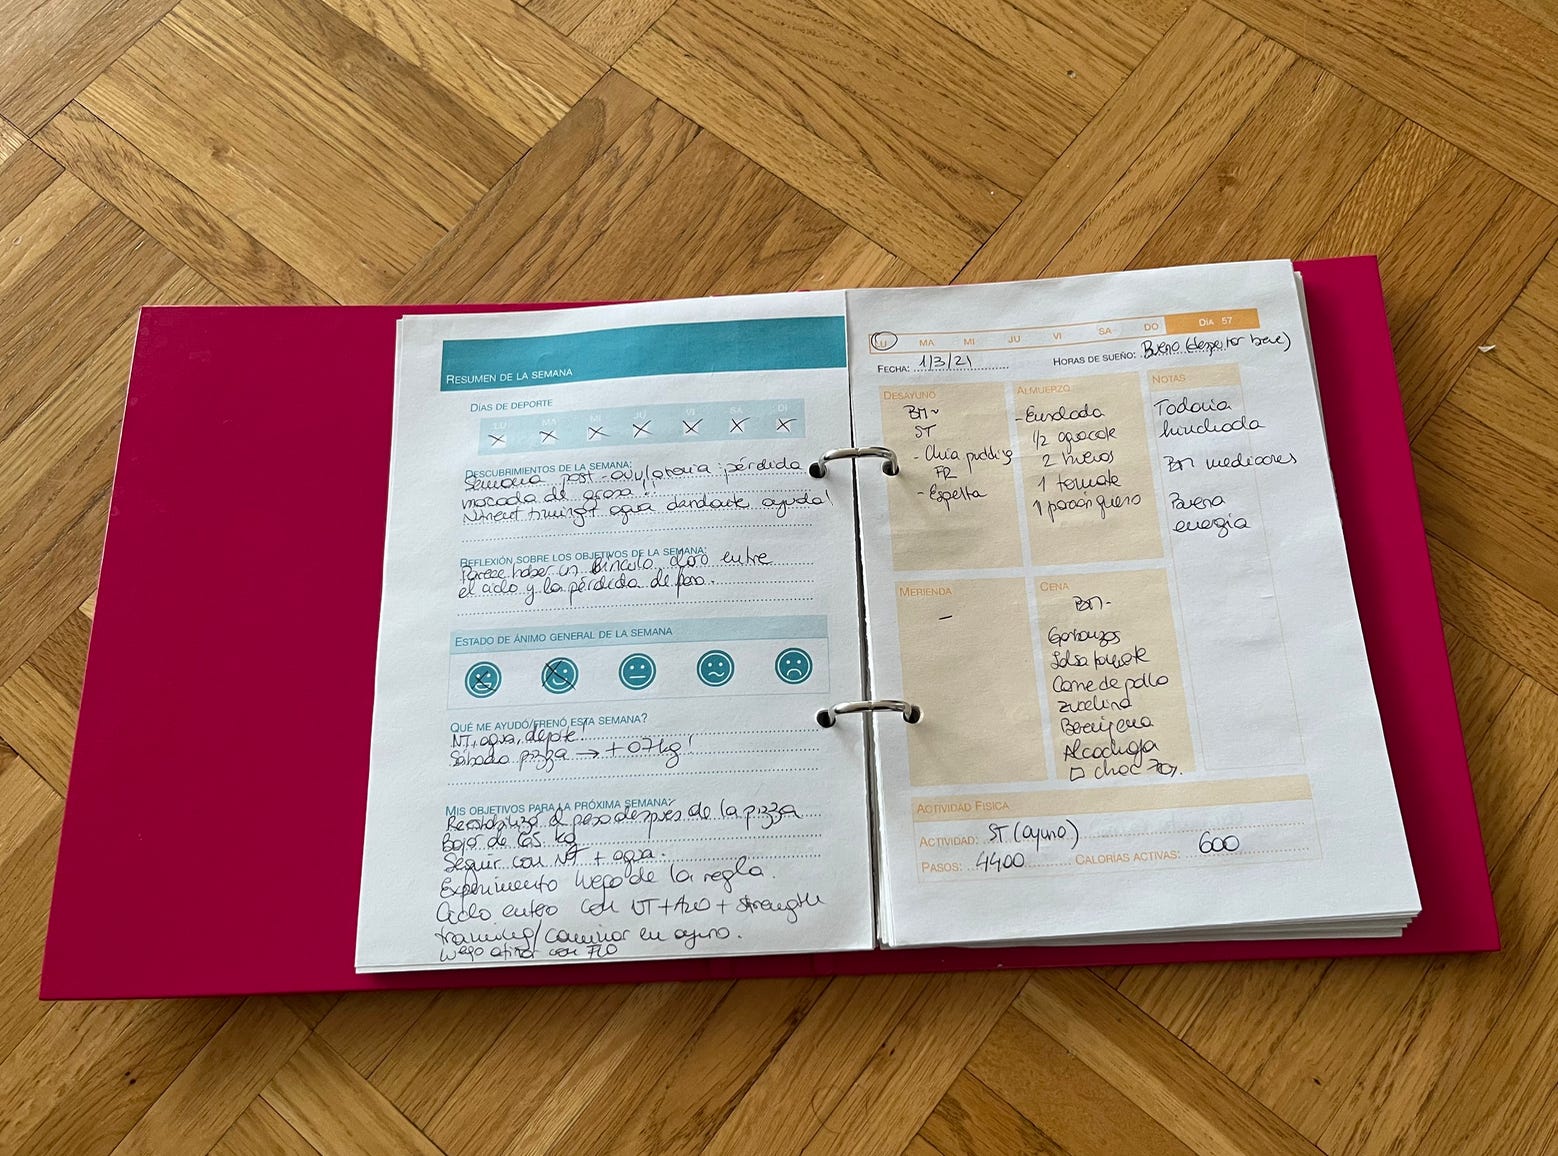
The method was not fixed from the start, which is worth saying because it makes this an experiment rather than a protocol. I began with a fast from Sunday to Monday lunch and high-fibre whole-food eating (plenty of veggies and unprocessed food for gut health). Around week seven I added structured nutrient timing (carb loading in the morning or lunch, low carb in the evenings) and made a serious effort on hydration, since I realized I had been drinking less water than I should have. Around week eight I added morning strength training (light or body weight).
Two caveats before you read anything into the results, because context matters here.
The first is about strength training. What I was doing in this diary, daily walking, pilates once or twice a week, and some fasted strength work added late, bears almost no resemblance to how I train now. For the past 18 months I have been lifting heavy, three to four sessions a week. That changes the body-composition picture significantly, in ways that matter for how you interpret everything from scale readings to fat percentage. The version of me in this experiment was building good habits. She was not yet building serious muscle.
The second caveat is one I offer with the particular discomfort of a scientist who should have known better. Fasted strength training was a mistake. I did not recognise it at the time, but I was almost certainly under-recovering and under-eating protein, which is precisely the wrong combination when your goal is to preserve muscle while losing fat. I would not do it this way now. I mention it not to undermine the experiment but because honesty about method is what separates a useful n=1 from a flattering story.
What the days looked like
Breakfast was typically sourdough or fibre bread with peanut butter and an egg, shifting later in the experiment toward chia pudding with nuts, cocoa and red fruits or a greek yoghurt parfait with nuts, fruit and some kind of seed (which are still my two staple breakfasts). Lunches leaned on legumes: lentils, chickpeas, quinoa, usually with eggs or fish or a small portion of meat and a large salad. Dinners were vegetable-heavy, fennel, artichoke, zucchini, broccoli, often with a small protein and almost always finished with a square of 70% dark chocolate.
The weekend looked different. Saturday was reliably pizza, beer and occasionally ice cream. Not a slip. A deliberate release valve!
Movement was mostly walking, daily and often long, with pilates once or twice a week and the fasted strength training added in the final weeks. Low intensity, high volume, a NEAT-heavy pattern that suited the energy I had at the time.
One more thing worth knowing before we get to the data. I kept stepping on the scale after the 90 days ended, right through to July 2021. I stopped logging every meal and every metric, but the morning weight and body-composition reading stayed. Six months of data in total, not ninety days.
Anna, If I had walked into your clinic with this plan, what would you change about my approach?
Mica, you built a sustainable system: whole foods and plenty of fibre, legumes and fish and vegetables you could keep eating for life. Long daily walks significantly contribute to energy expenditure, while the deliberate weekend release valve may help avoid the restrict-then-collapse pattern most people fall into.
Guiding you toward fat loss, I would change only two things.
The first is what you measured
You read your progress from a scale and a body-composition estimate and never reached for a tape measure, and across these weeks your interventions affected your body’s water retention rather than its fat.
Glycogen is the form in which the body stores carbohydrate, held in the muscles and the liver, and every gram of it is bound to roughly three grams of water.
When you fasted on Mondays you drew that glycogen down and lost its water with it, and the scale fell without any fat leaving.
When you corrected your hydration around week seven, you changed how much fluid your body was holding. When you added training, your muscles began storing more glycogen, and more water came with it, so the scale could climb even as you were becoming leaner.
And every Saturday the pizza and beer brought a load of salt and carbohydrate: the salt draws water in and the carbohydrate refills glycogen, so by Sunday morning you weighed more, all of it water rather than fat regained overnight.
So the scale was adding up everything you were carrying, and water is the part of that total that swings most from one day to the next.
The rises and falls you observed, Mica, were largely your own water coming and going, laid over a real and gradual loss of fat that the water kept hiding.
The waist measurement is what would make a difference. Water moves everywhere in the body and shows up as quick swings on the scale, whereas fat sits mainly around the middle (and the hips in ladies below 45), and changes only over weeks.
A tape measure taken, under the same conditions each time, barely registers the daily water and captures the actual fat changes, which is what separates the two.
The second is protein, and the muscle it protects
Through the day your meals were rather insufficient in protein: a single egg at breakfast, legumes at lunch, a small portion of protein at dinner. In a fat-loss phase, sufficient protein intake (which is more than you think) is what keeps muscle protected. With too little protein intake, the body may draw on muscle for fuel when there’s an energy deficit. Yours was low, and spread too thinly across the meals to do that job.
Add training in a fasted state, on too little protein and too little recovery, and the problem compounds: the muscles are asked to repair while denied the building blocks and the rest they need, which leaves them as the tissue most likely to be lost during weight loss.
Muscle is where most of the glucose is handled, and it becomes harder to hold with each decade past forty, so losing it makes the whole project harder.
I would raise your dietary protein, spread it more evenly across the day, and feed the training rather than starve it.
Something I return to often is that when the goal is fat loss, how you lose the weight deserves as much attention as how much. However, even an imperfect plan is better than no plan: your approach still served your goals and achieved good results.
By increasing protein and including it in every meal, combined with fed state training, those results could have been stronger: more of the weight you lost would have been fat, and more of your muscle would have been maintained.
Let’s look at your data now Mica.
What the Data Showed
Six months of my daily readings produced a lot of numbers. What followed is what those numbers actually said, once I stopped reacting to them one morning at a time and started reading the shape of the whole thing.
Overall results
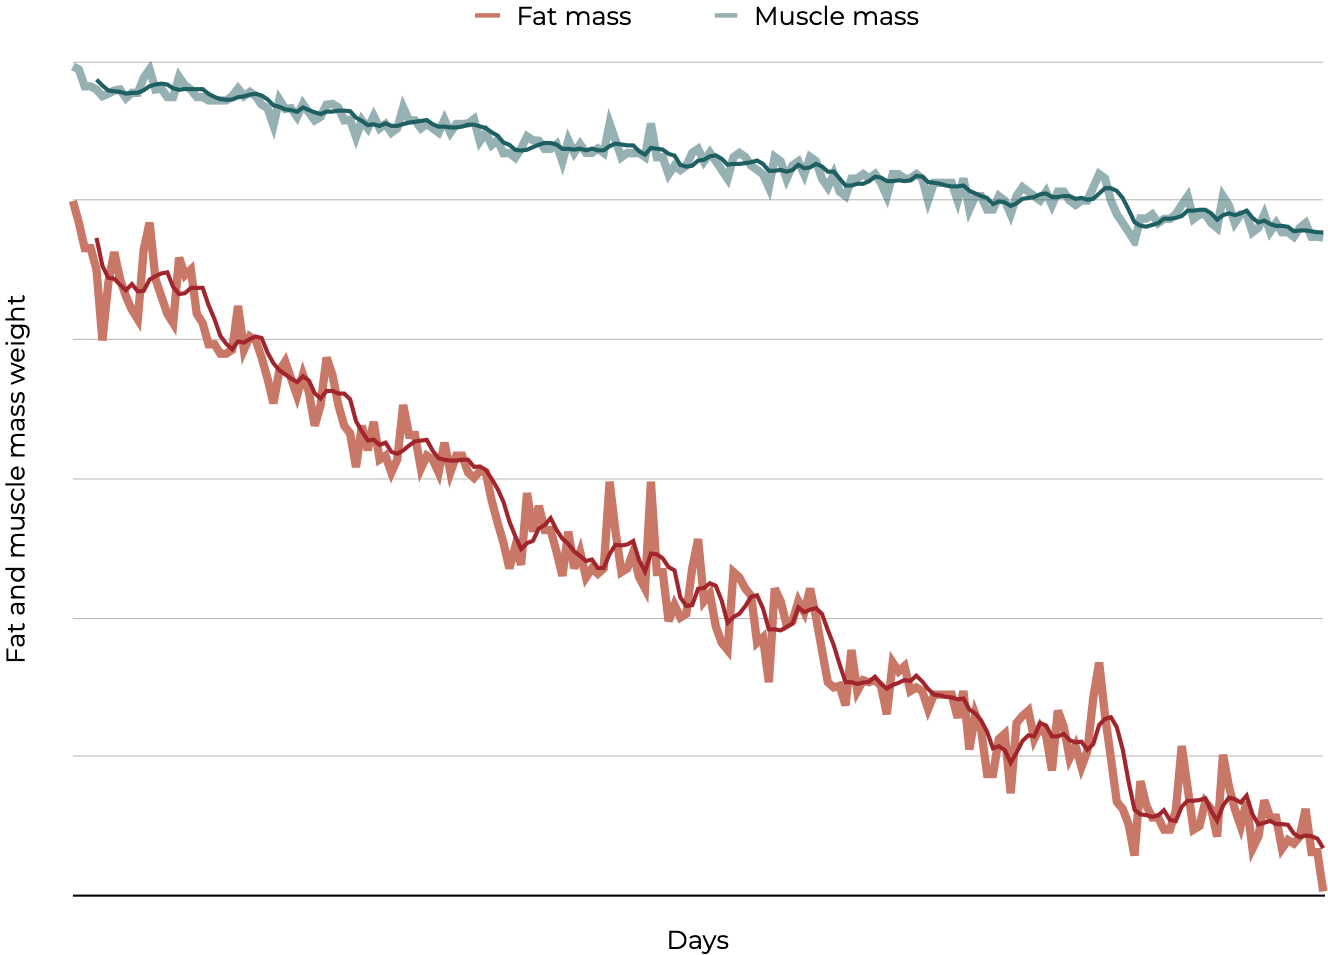
Regardless of the absolute values, which, as noted above, a 29-euro bioimpedance scale cannot claim to be precise about, the composition of what I lost was the finding worth paying attention to.
Of the total weight lost across six months, 63% was fat mass and only 16% was muscle mass.
And so the math makes sense, Mica, the rest of it is water and glycogen that go together with the muscle lost.
It is a meaningful result for a pre-serious-lifting baseline, and it illustrates why the scale weight number alone tells you almost nothing useful. The scale does not distinguish between what you are losing. The composition data, imperfect as it is, does.
The within-week wave: the Saturday pattern
The weekly pattern was the first thing I noticed, and it was the most immediately readable. Almost every Saturday morning produced the week’s lowest reading. Almost every Sunday morning produced a jump. By Monday morning, the scale had not yet fully recovered.
The mechanism behind the Saturday low is probably the Friday glass of wine. Combined with a controlled Friday dinner, the effect compounds into the week’s lowest reading.
Wine suppresses the antidiuretic hormone, encouraging your kidneys to release more water than they otherwise would. This way you may have been slightly dehydrated and combined with the modest Friday meal the result was to weigh less on Saturday morning than you did the evening before. No fat was gone, only water.
Then Saturday evening reversed the reading completely. Pizza, beer, sodium, refined carbohydrates: all of these pull water into the tissues overnight. By Sunday morning the scale is up, and it carries into Monday. Had I only weighed myself on Monday mornings, as many women do, I would have caught myself at the worst possible moment in my weekly cycle, and reading a water signal as a fat verdict.
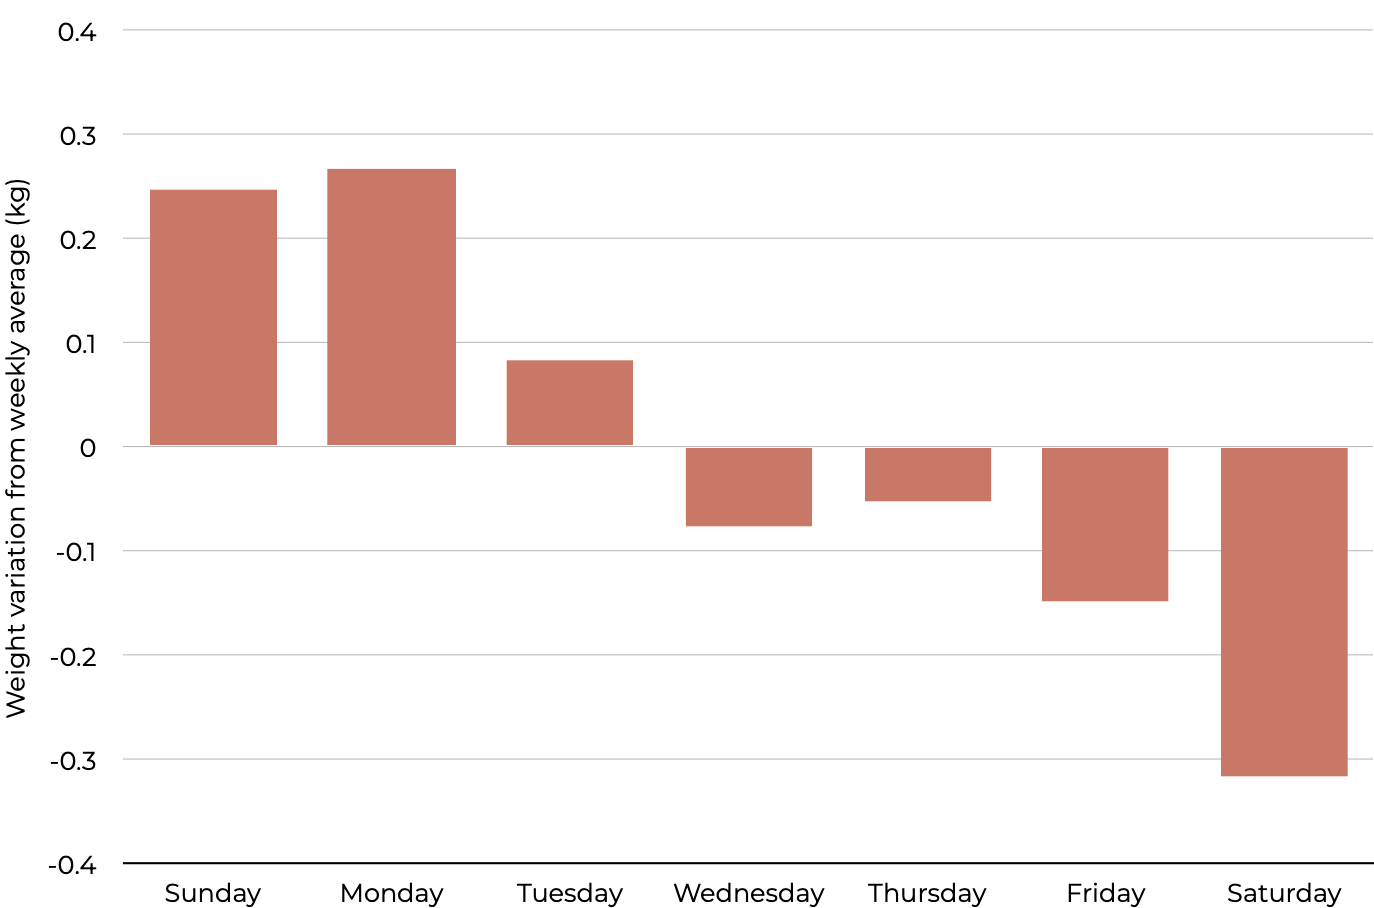
The graph shows the average deviation from each week’s mean weight, by day of the week, calculated across 30 weeks of daily measurements. Saturday is the week’s low. Sunday and Monday are the week’s high. The difference between Saturday morning and Monday morning is nearly 0.6 kg on average. If you want to see what the pizza actually did to my glucose in real time, the insulin resistance and CGM post shows you in painful detail.
The within-cycle wave: the pattern I discovered in real time
The cycle pattern took longer to pin because it operates on a longer clock, an infradian clock (longer than a day). In week one of tracking I wrote: “my period affects weight.” By week six: “is this a luteal phase effect? Is the second half of my period the answer?” The hypothesis formed slowly, in my own handwriting.
The graph plots weight change relative to cycle day one across all seven cycles I tracked within those six months. The individual lines are noisy, as you would expect. But the 3-day rolling average cuts through that noise cleanly: weight sits close to day-one levels for the first half of the cycle, then steps down progressively from around day 14 onward, reaching roughly one kilogram below baseline by the end.
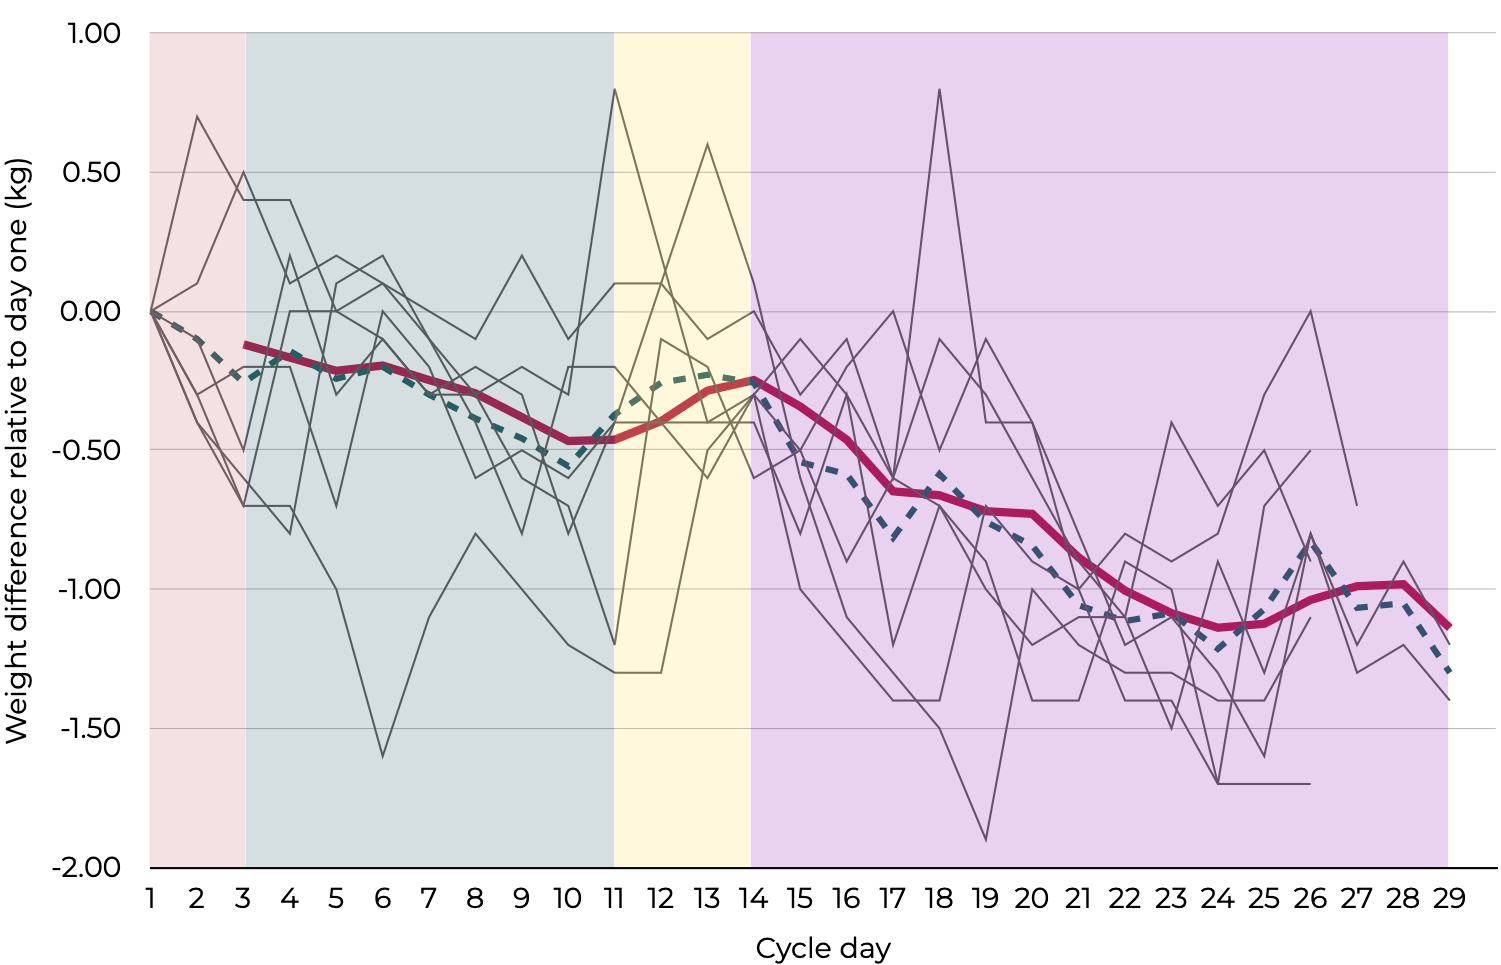
My interpretation at the time was that fat loss was happening in week three, that something about the late follicular and periovulatory window (that is, the second half of my period) was accelerating the process. Was progesterone doing something with my weight? The more accurate reading is that fat loss was continuous throughout each cycle.
What changed in week three was not the rate of fat loss but the visibility of it.
If you believe fat loss happens only in week three, you will feel like you are failing during the other three weeks when the scale does not move. If you understand that the scale is showing you water, not fat, the frustration dissolves. The weeks the scale stalls are not evidence you failed. They are evidence your body is doing what bodies do.
The mechanism behind the pattern.
The mechanistic explanation to your observations, Mica, is that in the second half of the cycle, after ovulation, progesterone rises. As a result, the kidneys hold on to more sodium than usual instead of passing it into the urine. Oestrogen adds to the effect, so the net result is more sodium held. Because salt holds on to water, that salt brings extra water with it, out into the tissues, into the spaces around the cells. That is the bloating and puffiness many women feel in the days before a period.
On the scale that may look like added weight, even if fat is reduced underneath. When the period begins and both hormones fall, the water is at its highest just before and at the initial days of your period, then clears progressively, and the scale comes down. Even if fat was not reduced that week, the water cleared.
Part of the reason the line falls comes down to the day everything is measured against. Each reading is compared with day one, the first day of your period, which is one of the most water-heavy days of the month, so every day after it looks lighter than it really is, and that drags the line down. The other part is actual fat loss: you were losing fat all month, so by the end of each cycle you actually weighed a little less than at the start of that cycle. Any single week observed changes are mostly due to water, and only the trend across several months shows the actual fat loss.
I also found that the luteal phase raises resting energy expenditure modestly compared to the follicular phase.1 This is smaller than popular wellness content claims and unlikely to account for the full pattern on its own, but it is a real and measurable shift that compounds with the fluid dynamics.
There is a small rise in energy use across the luteal phase but I would say it is negligible. So, I would say that the fluid changes rather than energy consumption changes is what produced the pattern you saw.
The bigger picture
There is a further reason to use your bioimpedance scale just to observe the trend towards weight loss. A foot-to-foot model like the one you used, sends its small current up one leg and down the other, so it reads mostly your lower body and estimates the rest, then turns that reading into a fat percentage using an equation drawn from average people. If for whatever reason you do not match the average it was calibrated on, in age, sex, build or training, the figure is not entirely accurate. If you compare them against DXA scan, the device clinics use to measure fat, muscle and bone, consumer scales commonly miss the true fat percentage by several points in either direction. Where they do better is in repeating themselves: weighed at the same time and in the same state, day after day, the same built-in error sits under every reading, so the change from one month to the next can be trusted far more than any single number. You were right, then, to follow the direction and set the absolute figures aside.
The one catch is that the device works out its fat and muscle figures from your body water. Because water rises and falls from one day to the next, those figures rise and fall with it, even when your real fat and muscle have not changed at all. Over a few days the scale can show your fat dropping when all that has actually left is water. The way around this is time: across enough mornings, the days you are holding extra water are balanced by the days you are holding less, so the water roughly evens itself out and stops pushing the figure up or down. What is left, once the water has averaged away, is the genuine change in fat.
Anna, ever since my experiment, I’ve wondered: is reading the scale harder in midlife? Would I have seen a different pattern when I was younger? What about in 10-15 years?
In your twenties the scale and the fat moved together. Muscle was in its peak during that stage of life so it stayed where it was. That means that when the number on the scale fell during a diet, it was fat leaving, and the scale could be trusted to show it. From your forties onward, muscle is vulnerable: through a stretch of eating less, it is lost more easily than before, unless protein and training actively protect it. So a falling number in midlife may reflect two things combined: fat you wanted to lose and the muscle you did not. The commercial bioimpedance scale is not able to tell which is lost.
The fat itself also comes off more reluctantly during midlife. As insulin resistance tends to increase with age, it keeps more fat locked in fat cells, while the fact that there’s less muscle reduces its fat burning capacity.
In midlife, when the scale’s single number blends fat, muscle and water together, the answer is to observe the weekly weight loss trend and how it moves from one month to the next. In addition, measure your waist, which reflects fat loss far more accurately than the scale does. Abdominal fat changes only over weeks, while water comes and goes from day to day. Measure waist circumference before a meal, at the same time of day, and not on a bloated day. Add what no device can show, how your clothes fit and whether your training is getting stronger, and you have a superior measure of progress. I set the waist-and-weight method out in full in “The Hidden Pattern Behind Weight Gain”.
After menopause weight loss is still tricky: with oestrogen diminished, there’s a higher tendency to store fat around the middle and muscle is lost at a faster rate than before. So the scale can remain unchanged for months while the body is in the process of trading muscle for fat.
This piece was written in collaboration by Dr. Mica, who writes Swiss Army Mum, a science-backed substack to long-term health for busy women, and Anna Papoutsa Shue, nutrition scientist, MSc, who writes The Metabolic Rebuild on metabolic and cardiovascular health.
The takeaways
What would I do differently? More protein, distributed across the day rather than front-loaded. No fasted strength training: I understand now that asking your muscles to adapt to a new stimulus while running on empty is not clever, it is just hard. And heavier lifting from the start: the version of me in this experiment was building habits, which was the right priority.
But if you want to preserve or increase muscle while losing fat, progressive resistance training is non-negotiable, and the research on this is not subtle. If you want to go deeper on both of those, my strength training post and the fuel post cover the mechanisms in detail.
What the experiment gave me that no plan could do was the ability to read my own signal. I stopped reacting to a number and started reading a trend. The scale is still on my bathroom floor. I still step on it most mornings. But I know what I am looking at: a data point in a much longer graph.
If you take one thing from Micaela’s six months of data, make it this: for the next month, stop relying on the scale for a daily answer. Weigh yourself under the same conditions, two or three mornings a week, and look only at the average across each week and how that average moves over the month, rather than at any single morning.
Measure your waist with a tape measure, the same way every time, once a fortnight. Use your scale as a record of direction, and read it over time. Whatever your age, whether or not you still cycle, the trend is key.
Löfberg IE, Karppinen JE, Laatikainen-Raussi V, Lehti M, Hackney AC, Ihalainen JK, Mikkonen RS. Resting Energy Expenditure, Metabolic and Sex Hormones in Two Phases of the Menstrual and Hormonal Contraceptive Cycles. Med Sci Sports Exerc. 2024 Dec 1;56(12):2285-2295. https:doi.org/10.1249/MSS.0000000000003518
Thanks Anna for your insight in this work!